Seems like security incidents are occurring more often with mild to
significant impact on consumers and various organizations, e.g. JP
Morgan Chase, Target, Sony, etc.
Referring to the Verizon Data
Breach Report year after year confirms that incident response times to
such incidents are increasing, rather than decreasing, with root cause
identification of the problems not occurring for months after the
security incident in many cases - this can cause a pessimistic view
among many security teams, however, there are a lot of good things
happening in the security space that I want to share with you.
Many
organizations have readily invested in various effective security
technologies and personnel training to help improve security posture and
minimize risk accordingly. A critical component to the incident
response problem is the time associated with weeding through all the
false alarms generated by various security devices, e.g. firewalls,
intrusion prevention systems, security reporting agents, etc. The
problem is further exacerbated by the growing speeds of networks and
network virtualization, many security tools simply can't process data
fast enough on 10G, 40G, or 100G network environments or simple lack
visibility.
The good news is that solutions are available to help
maintain visibility in such high-speed networks. Such solutions can
also correlate network transactions with security alarms to help
identify problems faster and decrease incident response times. The key
is to integrate loss-less network recording systems with existing
security tools using feature-rich application programming interfaces
(APIs). The APIs help with automating security related tasks.
Security
automation is key to decreasing incident response time. Imagine being
able to automate the retrieval and correlation of network transactions
to any security log event aggregated into a SIEM, or mapping packet data
to any IPS alarm, or pinpointing application threads that trigger a
specific application performance alarm - this is all possible now with
high-speed loss-less recording systems and API integration with SIEMs,
Firewalls, IPS devices, and Application Performance Monitoring (APM)
systems. Yes, I am assuming your organization invested in these
solutions...
As a side note, Real-time NetFlow generation on
dedicated appliances is proving to be a good solution where full
recording options are not available due to privacy policy conflicts,
these solutions can provide much better network visibility than legacy
NetFlow implementations that rely on network sampling, especially over
40G and 100G network environments. NetFlow is coming back in a strong
way to provide security teams much needed visibility, NetFlow isn't just
for Network Operations anymore.
The bottom line is this,
mainstream security products are becoming more open to integration with
3rd party solutions and high-speed network recording system are becoming
more affordable. As a result, the security automation described above
will become more prevalent among security operation teams as time goes
on and this is a very good thing in my humble opinion.
The
security industry as a whole is improving, there is much more
collaboration going on now than ever before, and I am seeing some
significant improvements being made among hardware and software vendors
that make me feel very optimistic about our capabilities to decrease our
incident response time moving forward. If your interested in seeing
some of the concepts discussed here in action, drop me a note, I would
be glad to setup a conference call and provide you a live
demonstration...
Stay well,
Boni Bruno
Tuesday, October 7, 2014
Monday, April 14, 2014
Heartbleed Detection
On April 7, the “Heartbleed” bug
was announced. It’s a serious flaw in the OpenSSL 1.0 – 1.0.1 code
series which affects all applications using it for encryption. In
short, it means that anyone who can connect to the server can remotely
read the server’s memory – including the SSL certificate secret key,
usernames and passwords, and anything else.
With the Heartbleed bug exploit code in the wild, anyone can take advantage of the critical time between public exposure of the exploit and when all organizations can patch (or take offline) vulnerable systems. So, for almost every organization in the world, there are three questions that come to mind. The first question is “which of my public facing servers is vulnerable?” The second question is “have I been exploited since this became public?” And the third question is “what have I lost?”
Having a packet capture fabric or Endace Intelligent Network Recorder (INR) in place helps answer all three questions. I'll reference INR here.
Which of my public facing servers is vulnerable?
The first step is to use your database (you DO have a database matching services, servers, and operating systems, right?) to locate those systems known to be vulnerable and that are public facing. Take them offline and patch them. Those are the knowns. Now, what about the unknowns?
You cannot use the presence of malformed heartbeat requests to confirm or deny vulnerability – that just tells you somebody is attacking, which is perhaps a common event these last few days! It is the heartbeat response that identifies whether a server is vulnerable. So what you need is to send each of your servers an exploit request and then filter on just heartbeat responses from vulnerable servers. As it turns out, that is surprisingly easy if you have an EndaceProbe INR monitoring your network.
First, download the exploit code off the Internet, set it up on a workstation running outside your firewall on a known IP address X. Have it run the exploit against every IP address in your domain. That’s what the bad guys are going to do … beat them to it! If you can’t set up your own attack system, there are websites already online that will attack for you. You just need to send them your IP addresses to attack.
Next, on the EndaceProbe INR which is monitoring traffic, set up a visualization that is filtering bi-directionally on IP address X – your attack workstation’s address. That will isolate the exploit attempts and responses. This filtering will result in a small amount of data over the length of time it takes for your exploit workstation to work through your IP address space.
From this visualization, click on the “packets” view and enter the following display filter:
(ssl.record.content_type == 24) && (ssl.record.length > 64)

The (ssl.record.content_type == 24) identifies all heartbeat requests and responses. Heartbeat requests (both valid requests and exploit requests) are typically less than 64 bytes long. Valid heartbeat responses should also be less than 64 bytes. So the (ssl.record.length > 64) should only catch responses returning lots of data back to your attacking workstation. That means every packet that matches the above display filter is probably from a server that is vulnerable. Locate the server by its IP address, pull it offline and patch it. Note: If you have SSL servers listening on different ports, Endace has a protocol identification module built in, so filtering on SSL within Vision will capture all the SSL packets of interest regardless of port number!
Have I been exploited?
Until April 7, this bug had been undiscovered (publicly), but it has existed in versions of the OpenSSL code for more than two years. It is therefore very difficult for an organization to fully determine its overall risk of having been exploited if someone discovered the bug earlier and has been using it nefariously. But what we do know is that the bad guys are most certainly monitoring vulnerability releases, especially ones that are accompanied by simple-to-use exploit code! Therefore, it stands to reason that an organization’s risk of exploit is highest between public disclosure of the exploit and time-of-patch.
So having an EndaceProbe INR with even a few days’ worth of storage allows the organization to perform an exhaustive post-mortem for those critical hours or days of maximum risk. Fortunately that EndaceProbe INR you have sitting behind your firewall will have captured 100 percent of the traffic from the last few days. Time to put it to use!
From step one above, you now (hopefully) have a short list of IP addresses for servers that are vulnerable. To make the search efficient, first look for the exploit attempt, and then for the response. This two-step process works best because:
Going through your vulnerable IP addresses one at a time, use a visualization that filters on the server’s destination IP address and destination port 443. (If you use other ports for SSL you’ll want to check that traffic too.) Now launch Endace Packets™ and enter:
((ssl.heartbeat_message.type == 1) && (ssl.heartbeat_message.payload_length > 61))

This filter might result in some false positives depending on whether or not there are legitimate clients out there that use heartbeat payloads > 61 bytes, but 61 seems to be the common number used. This filter will identify heartbeat request packets where the ssl.heartbeat_message.payload_length is larger than normal – a strong indication of an exploit attempt.
If you see any results from this filter, then it is time to look at the heartbeat response. So, back to your visualization! Filter on the attacker’s IP address as the destination. You could just stop there and look at everything sent to the attacker on any port, but depending on how much traffic that is, you might want to step through one vulnerable server at a time. If slow and steady is your style, then you will also filter on the source IP address of the vulnerable server detected above, with destination port taken from the heartbeat request packet.
Now, launch Endace Packets and enter the same exploit response filter you used before:
(ssl.record.content_type == 24) && (ssl.record.length > 64)
This will identify if the server responded to the exploit. You’ve already confirmed that server is vulnerable, so it probably sent a large amount of RAM data back to the attacker. Bad news, but at least you know for sure you’ve been exploited. Now…
What have I lost?
The heartbeat response will consist of several IP packets forming a single TCP PDU. Overall size of the PDU will depend on how large the (false) payload size was in the exploit heartbeat request. The response PDU is easy to identify in Endace Packets, but it is encrypted so you won’t be able to see what is inside. Time for Wireshark!
Use the EndaceProbe INR download capability to download the exploit session to your workstation. You’ll need to get the private SSL key from the exploited server, load it in Wireshark, decrypt the response message, and determine whether anything important is there. It’s time-consuming work, but well worth knowing what, if anything, has been lost!
What about workstations?
The SSL heartbeat is symmetrical, so, in theory, an OpenSSL client can be attacked by a malicious server just as easily as a server can be attacked by a client. This should be your next concern. Windows and Mac appear to be safe, but what about your Linux workstations? Workstations are harder to test because they won’t respond to a direct attack. They have to go to a malicious website before you will see any exploit heartbeat requests coming to them.
Good luck with your mitigation efforts, and please let us know if there’s anything we can do to help with this process.
Regards,
Boni Bruno
With the Heartbleed bug exploit code in the wild, anyone can take advantage of the critical time between public exposure of the exploit and when all organizations can patch (or take offline) vulnerable systems. So, for almost every organization in the world, there are three questions that come to mind. The first question is “which of my public facing servers is vulnerable?” The second question is “have I been exploited since this became public?” And the third question is “what have I lost?”
Having a packet capture fabric or Endace Intelligent Network Recorder (INR) in place helps answer all three questions. I'll reference INR here.
Which of my public facing servers is vulnerable?
The first step is to use your database (you DO have a database matching services, servers, and operating systems, right?) to locate those systems known to be vulnerable and that are public facing. Take them offline and patch them. Those are the knowns. Now, what about the unknowns?
You cannot use the presence of malformed heartbeat requests to confirm or deny vulnerability – that just tells you somebody is attacking, which is perhaps a common event these last few days! It is the heartbeat response that identifies whether a server is vulnerable. So what you need is to send each of your servers an exploit request and then filter on just heartbeat responses from vulnerable servers. As it turns out, that is surprisingly easy if you have an EndaceProbe INR monitoring your network.
First, download the exploit code off the Internet, set it up on a workstation running outside your firewall on a known IP address X. Have it run the exploit against every IP address in your domain. That’s what the bad guys are going to do … beat them to it! If you can’t set up your own attack system, there are websites already online that will attack for you. You just need to send them your IP addresses to attack.
Next, on the EndaceProbe INR which is monitoring traffic, set up a visualization that is filtering bi-directionally on IP address X – your attack workstation’s address. That will isolate the exploit attempts and responses. This filtering will result in a small amount of data over the length of time it takes for your exploit workstation to work through your IP address space.
From this visualization, click on the “packets” view and enter the following display filter:
(ssl.record.content_type == 24) && (ssl.record.length > 64)

The (ssl.record.content_type == 24) identifies all heartbeat requests and responses. Heartbeat requests (both valid requests and exploit requests) are typically less than 64 bytes long. Valid heartbeat responses should also be less than 64 bytes. So the (ssl.record.length > 64) should only catch responses returning lots of data back to your attacking workstation. That means every packet that matches the above display filter is probably from a server that is vulnerable. Locate the server by its IP address, pull it offline and patch it. Note: If you have SSL servers listening on different ports, Endace has a protocol identification module built in, so filtering on SSL within Vision will capture all the SSL packets of interest regardless of port number!
Have I been exploited?
Until April 7, this bug had been undiscovered (publicly), but it has existed in versions of the OpenSSL code for more than two years. It is therefore very difficult for an organization to fully determine its overall risk of having been exploited if someone discovered the bug earlier and has been using it nefariously. But what we do know is that the bad guys are most certainly monitoring vulnerability releases, especially ones that are accompanied by simple-to-use exploit code! Therefore, it stands to reason that an organization’s risk of exploit is highest between public disclosure of the exploit and time-of-patch.
So having an EndaceProbe INR with even a few days’ worth of storage allows the organization to perform an exhaustive post-mortem for those critical hours or days of maximum risk. Fortunately that EndaceProbe INR you have sitting behind your firewall will have captured 100 percent of the traffic from the last few days. Time to put it to use!
From step one above, you now (hopefully) have a short list of IP addresses for servers that are vulnerable. To make the search efficient, first look for the exploit attempt, and then for the response. This two-step process works best because:
- The amount of traffic into the server is typically much less than out. It is faster to search the traffic coming in.
- The exploit arrives on port 443, so is easy to filter on that port. The response can go out on any port number.
Going through your vulnerable IP addresses one at a time, use a visualization that filters on the server’s destination IP address and destination port 443. (If you use other ports for SSL you’ll want to check that traffic too.) Now launch Endace Packets™ and enter:
((ssl.heartbeat_message.type == 1) && (ssl.heartbeat_message.payload_length > 61))

This filter might result in some false positives depending on whether or not there are legitimate clients out there that use heartbeat payloads > 61 bytes, but 61 seems to be the common number used. This filter will identify heartbeat request packets where the ssl.heartbeat_message.payload_length is larger than normal – a strong indication of an exploit attempt.
If you see any results from this filter, then it is time to look at the heartbeat response. So, back to your visualization! Filter on the attacker’s IP address as the destination. You could just stop there and look at everything sent to the attacker on any port, but depending on how much traffic that is, you might want to step through one vulnerable server at a time. If slow and steady is your style, then you will also filter on the source IP address of the vulnerable server detected above, with destination port taken from the heartbeat request packet.
Now, launch Endace Packets and enter the same exploit response filter you used before:
(ssl.record.content_type == 24) && (ssl.record.length > 64)
This will identify if the server responded to the exploit. You’ve already confirmed that server is vulnerable, so it probably sent a large amount of RAM data back to the attacker. Bad news, but at least you know for sure you’ve been exploited. Now…
What have I lost?
The heartbeat response will consist of several IP packets forming a single TCP PDU. Overall size of the PDU will depend on how large the (false) payload size was in the exploit heartbeat request. The response PDU is easy to identify in Endace Packets, but it is encrypted so you won’t be able to see what is inside. Time for Wireshark!
Use the EndaceProbe INR download capability to download the exploit session to your workstation. You’ll need to get the private SSL key from the exploited server, load it in Wireshark, decrypt the response message, and determine whether anything important is there. It’s time-consuming work, but well worth knowing what, if anything, has been lost!
What about workstations?
The SSL heartbeat is symmetrical, so, in theory, an OpenSSL client can be attacked by a malicious server just as easily as a server can be attacked by a client. This should be your next concern. Windows and Mac appear to be safe, but what about your Linux workstations? Workstations are harder to test because they won’t respond to a direct attack. They have to go to a malicious website before you will see any exploit heartbeat requests coming to them.
Good luck with your mitigation efforts, and please let us know if there’s anything we can do to help with this process.
Regards,
Boni Bruno
Wednesday, July 24, 2013
2013 Las Vegas Interop Network Usage
Interop Las Vegas is over for another year, and as we recover from the excess that comes with every event that happens in Vegas, we’ve had a chance to look at the data captured from the pair of EndaceProbe appliances I deployed on InteropNet. And they tell a fascinating story about what people do when they’re not listening to vendor pitches!
For anyone not familiar with InteropNet, it’s the network that provides the 18,000 show visitors and 285 vendors that exhibit with connectivity. Given the nature of the show, it’s become a showcase in its own right for the very latest networking, security and monitoring products. We’re proud to have been invited to deploy our EndaceProbe appliances in the network analysis and forensics product category.
The EndaceProbe appliances, with 10Gb Ethernet (10GbE) interfaces and 64TB of local storage, were deployed so that they could see, capture and record every packet on the network. Between Tuesday at 4:00 p.m. and noon on Thursday, the EndaceProbe appliances recorded an incredible 72 billion packets. The dropped packet counter on the EndaceProbe recorded zero packet loss, so when I say that 72 billion packets traversed the network, I really mean 72 billion packets traversed the network and captured every single one to disk. Those 72 billion packets translate to:
68GB of metadata that can be used to generate EndaceVision visualizations.
6.1TB of packet data that can be retrieved through EndaceVision in a few short clicks for a full payload investigation in packets, or Wireshark.
Users of the network consumed more than 130GB of iTunes traffic (7th highest on the list of application usage) and 100 GB of bit torrent (10th highest on the list). Whether vendors should be taking this as an insight into how interesting their presentations are is an interesting question in its own right!
On the network itself, the average bandwidth utilization was just 350 Mbps, however, what’s interesting – and what few organizations understand given the lack of fidelity in their monitoring tools – is that the network was regularly bursting to 8Gbps and had frequent spikes of 10Gbps (measured in the millisecond range).
The ability to see traffic spikes at such a low level of resolution is critical for understanding the behavior of the network and planning for the future. With the wrong tools, you could easily be mistaken to thinking that a 1Gbps link would be sufficient to handle InteropNet traffic. But you’d be very wrong indeed….
An interesting anecdote from the NOC that highlights the power of EndaceVision came from an escalation inside the NOC that the show wifi was slow. In a few clicks, we were able to show that the problem was coming from a single user (Silvio, we know who you are!) who decided to download more than 300GB of data over the network and saturate the resource.
So, until next year, we bid Las Vegas farewell and head home for a well deserved rest.
Thursday, August 16, 2012
Packet Capture Retention Policy???
How long should I store packet captures? How much storage should I provision to monitor a 10Gbps link? When is NetFlow enough, and when do I need to capture at the packet level?
These are questions network operations managers everywhere are asking, because unfortunately best practices for network data retention policies are hard to find. Whereas CIOs now generally have retention policies for customer data, internal emails, and other kinds of files, and DBAs generally know how to implement those policies, the right retention policy for network capture data is less obvious.
The good news is that there are IT shops out there that are ahead of the curve and have figured a lot of this out.
Background
To begin with, it’s important to clarify for your own organization what the goals are for network history. Some common answers include:
Respond faster to difficult network issues
Establish root cause and long-term resolution
Contain cyber-security breaches
Optimize network configuration
Plan network upgrades.
You may notice that the objectives listed above vary in who might use them: stakeholders could include Network Operations, Security Operations, Risk Management, and Compliance groups, among others. While these different teams often operate as silos in large IT shops, in best-practice organizations these groups are cooperating to create a common network-history retention policy that cuts across these silos (and in the most advanced cases, they have even begun to share network-history infrastructure assets, a topic we discussed here).
Some of your objectives may be met by keeping summary information – events, statistics, or flow records for example – and others commonly require keeping partial or full packet data as well. A good retention policy should address the different types of network history data, including:
Statistics
Events
Flow records – sampled
Flow records – 100%
Enhanced flow records or metadata (such as IPFIX, EndaceVision metadata, etc.)
Full packet data – control plane
Full packet data – select servers, clients, or applications
“Sliced” packet headers – all traffic
Full packet data – all traffic.
Generally speaking, the items at the top of the list are smaller and therefore cheaper to keep for long periods of time; while the items at the bottom are larger and more expensive to keep, but much more general. If you have the full packet data available you can re-create any of the other items on the list as needed; without the full packet data you can answer a subset of questions. That leads to the first principle: keep the largest objects (like full packet captures) for as long as you can afford (which is generally not very long, because the data volumes are so large), and keep summarized data for longer.
Next, you should always take guidance from your legal adviser. There may be legal requirements arising from regulation (PCI, Rule 404, IEC 61850, etc.), e-discovery, or other sources; this article is not meant to be legal advice.
Now that said, in the absence of specific legal requirements that supersede, here are the best practices we’re seeing in the industry. Working the list from bottom to top:
Packet data for all traffic: 72 hours
Full packet data or “sliced” packet headers? The choice here will depend on how tightly controlled your network is and on what level of privacy protection your users are entitled to. For highly controlled networks with a low privacy requirement, such as banking, government or public utilities, full packet capture is the norm. For consumer ISPs in countries with high privacy expectations, packet header capture may be more appropriate. General enterprise networks fall somewhere in between.
Whichever type of packet data is being recorded, the goal consistently stated by best-practice organizations is a minimum of 72 hours retention, to cover a 3-day weekend.
For the most tightly-controlled networks retention requirements may be 30 days, 90 days, or longer.
Packet data for control plane & for select traffic: 30+ days
Control plane traffic can be extremely useful in troubleshooting a wide variety of issues. It’s also a type of traffic that is owned by the network operator, not the customer, so even networks that don’t record all traffic should keep history here.
Traffic types of interest include for example:
Routing protocols (OSPF, IS-IS, EIGRP, BGP; plus protocols like RSVP, LDP, BFD, etc. in carriers)
L2 control plane (ARP, spanning tree, etc.)
ICMP
DHCP
DNS
LDAP, RADIUS, Active Directory
Signaling protocols like SIP, H.225.0, SCCP, etc.
GTP-C in mobile networks
In addition to control plane traffic, in every network there are particular servers, clients, subnets, or applications that are considered particularly important or particularly problematic. For both control-plane and network-specific traffic of interest, organizations are storing a minimum of 30 days of packet data. Some organizations store this kind of data for up to a year.
Flow records @ 100%: 120+ days
Best-practice organizations record either enhanced metadata (such as that collected by EndaceVision), or at least basic NetFlow v5/v9/IPFIX.
This flow data is useful for a wide variety of diagnosis and trending purposes. Although a few router models can generate flow records on 100% of traffic, best-practice is to separate this function onto a separate probe appliance connected to the network via tap, SPAN or matrix switch. The probe appliance both offloads the router/switch and also enhances flow data with DPI / application identification information.
Best-practice here is to store at least 120 days of flow data. (We have seen organizations that keep 100% flow records for as long as seven years.)
Samples and summaries: 2 years or more
sFlow or sampled NetFlow, using 1:100 or 1:1000 packet samples, can be useful for some kinds of trending and for detecting large-scale Denial of Service attacks. There are significant known problems with sampled NetFlow, so it’s not a replacement for 100% flow, but it does have usefulness for some purposes.
Summary traffic statistics – taken hourly or daily, by link and by application – can also be helpful in understanding past trends to help predict future trends.
Because this data takes relatively little space, and because it is mostly useful for trending purposes, organizations typically plan to keep it for a minimum of two years.
One point to remember in maintaining history over periods of a year or longer is that network configurations may change, creating discontinuities. It’s important to record every major network topology change or configuration change alongside your traffic history data, so you don’t compare incomparable data and draw the wrong conclusions.
Average vs Peak vs Worst-case?
One challenge faced in sizing network-history storage capacity is the fact that well-designed networks run well below 100% capacity most of the time, but in times of stress (which is when network history is most valuable) they may run much hotter. Should you size for 72 hours of typical traffic, or 72 hours of worst-case?
The best-practice we’ve seen here is to make sure your network history system can capture at worst-case rate, but has enough storage provisioned for typical rate. The reasoning here is that when the network gets very highly loaded, someone will be dragged out of bed to fix it much sooner than 72 hours, so a long duration of history is not needed; but that person will want to be able to rewind to the onset of the event and will want to see a full record of what was happening immediately before and after, so having a system that records all traffic with zero drops is crucial.
Here’s an example to make it concrete:
Suppose you have a 10Gbps link that averages 1Gbps over a 24-hour period, and 3Gbps over the busiest hour of the day.
Then 72 hours of full packet storage at typical load would require
(1Gbit/sec x 72 hours x 3600 sec/hour / 8 bits/byte)
= 32400 Gbytes, or about 32 terabytes.
Under worst-case load, when recording is most important, it could run at the full 10Gbps, which would fill storage 10 times as fast. The good news is: best-practice here says you do not need to provision 10x the storage capacity, but you should be using a capture system that can record at the full 10Gbps rate. That means that in a worst-case scenario your storage duration would be more like 7 hours than 70; but in that kind of scenario someone will be on the case in much less than 7 hours, and will have taken action to preserve data from the onset of the event.
Of course, the same considerations apply for other types of network history: systems need to be able to process and record at the worst-case data rate, but with reduced retention duration.
Other considerations
The above discussion slightly oversimplifies the case; there are actually two more important considerations to keep in mind in sizing storage for network history.
First, most recording systems will store some metadata along with packet captures, and this adds some overhead to the storage needed – typically around 20%, though it may vary depending on the traffic mix and on the recording product you use.
Second, while we say above you should provision storage for typical load, most organizations actually use projected typical load, extrapolating the traffic trend out to 18-36 months from design time. How far ahead you look depends on how often you are willing to upgrade the disks in your network recording systems. A three-year upgrade cycle is typical, but with disk capacity and costs improving rapidly there are situations where it can be more cost-effective to provision less storage up front and plan to upgrade every 24 months.
Implementing the policy
When organizations first take on the challenge of standardizing network-history retention policy, they nearly always discover that their current retention regime is far away from where they think it needs to be.
Typically we have seen that implementing a best-practice retention policy happens in six phases:
Create the “idealized” policy describing where you want to be, without regard to current state
Inventory the current state and identify how far off it is from the ideal
Set targets for 3-6 months, 12 months and 24 months
Over the 3-6 month horizon, take low-hanging fruit by reconfiguring existing systems to optimize for the new policy, and identify what new technologies will be needed to achieve the chosen retention policy
Over the 12-month horizon, pilot any new technologies that may be required to achieve the long-term policy
Over the 24-month horizon, roll out these technologies network-wide.
Summary checklist
Bring together stakeholders to develop a common network-history retention policy
Understand everyone’s objectives
Check with legal adviser
Choose what types of data will be kept for what purposes
Set idealized retention goals for each
Inventory current state and gaps
Close the gaps over 24 months.
Monday, November 22, 2010
Why Protocol Validation is Important!!!
I've played with a lot of security technologies over the years and I’m quite amazed at the lack of protocol validation implemented with a majority of the commercial security solutions in the market today.
Protocol validation is really a very effective way to address zero-day attacks, application attacks, worms, and numerous other attack vectors. For example, let's say your web server receives a client request for an unknown method, before processing such a request, ask yourself what is an effective way to deal with unknown method attacks. Would signatures be an appropriate solution? Maybe trapping the requests and creating an error on the web server would be a better solution – I would do this on the server side. I would also argue, at least for network security devices, that inspecting the traffic for any method that exceeds a set number of alphanumeric characters (this should be a configurable parameter) would be a better way to go...
Say some unknown method is received over the network that is not a GET, HEAD, POST, PUT or whatever else you deem suitable for your web serving environment, instead of trying to come up with various signatures to combat an unknown method attack, simply allow a set number of methods and address the unknown methods by limiting them to say 15 characters. Any unknown method attack that exceeds 15 characters (in this example) will not be allowed to the web servers. This will save on system resources, security analysis time, and provide a nice mechanism to address various protocol issues. Yes security signatures are important, but it’s a mistake to limit your security solutions to just signature matching alone - look into protocol validation as well!
The unknown method attack I describe here is just one example I'm highlighting to show that protocol validation can capture any variant of an unknown method attack quickly and efficiently. Same is true if you implement protocol validation on various URI parameters. You can also apply protocol validation to other services like MS RPC services, MS CIFS services, DNS, SSH, SIP, etc.
Remember Conficker? Conficker is a MS RPC worm that makes changes to UUID/Stub Lengths in Microsoft’s Operating Systems. Instead of relying on signatures to catch every variant of Conficker, why not use protocol validation to protect the various UUID/Stub Lengths in the OS and allow users to customize and set maximum stub lengths for each operation number and UUID accordingly? This would provide proactive protection against a variety of MS RPC attacks without relying on any signatures.
There are many benefits to incorporating protocol validation into your security solutions and it must become an integral part of any network security device being considered today to mitigate network attacks against your systems or you will simply be too exposed.
Next time you evaluate some sort of network security device, make sure you check whether protocol validation is being enforced in a comprehensive way, if not, move on...
Stay secure!
-boni bruno
Monday, January 4, 2010
Malicious PDF documents on the rise...
There are some nasty malicious PDF files (read more…) going around the Internet for which most Anti-Virus tools provide little or no detection. As a good security precaution, if you use or read PDF files, you should take the following two actions:
1. Make sure you are using the latest version of Adobe Reader (formerly known as Adobe Acrobat Reader), which as of this writing is 9.2.0 (Open Adobe Reader and choose Help->About… to see what version you have installed, and then Help->Check for Updates to get the latest version.)

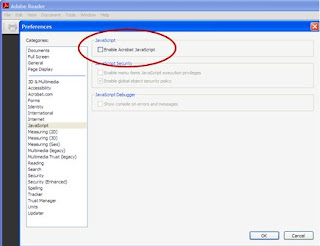
2. Open Adobe Reader and disable JavaScript by choosing Edit->Preferences->JavaScript and the uncheck the checkbox next to “Enable Acrobat JavaScript” as shown below.
Wishing you a safe computing year in 2010,
-boni bruno
1. Make sure you are using the latest version of Adobe Reader (formerly known as Adobe Acrobat Reader), which as of this writing is 9.2.0 (Open Adobe Reader and choose Help->About… to see what version you have installed, and then Help->Check for Updates to get the latest version.)

2. Open Adobe Reader and disable JavaScript by choosing Edit->Preferences->JavaScript and the uncheck the checkbox next to “Enable Acrobat JavaScript” as shown below.

Wishing you a safe computing year in 2010,
-boni bruno
Friday, June 26, 2009
Physical Access Control - The New Way
Historically, physical access controls have never run over IP networks, but now with Cisco in the game, the convergence for a complete physical access control solution over IP networks is now a reality.
The Cisco Physical Access Control solution is made up of both hardware and software components. The Cisco Access Gateway connects door hardware (traditional readers and locks,as well as the new Hi-O® hardware from Assa Abloy) to an IP network. In wired deployments, the device is capable of being powered by Power over Ethernet (PoE). It is also possible to connect to the gateway over a Wi-Fi 802.11a/b/g wireless link.
The diagram below depicts a typical Cisco PAC archtiecture:

Since there is a gateway for each door, access control can be deployed incrementally, door by door. There is no central panel; this simplifies system design, wiring, and planning, resulting in significant cost savings over legacy architectures. Additional modules can be connected to the gateway, allowing for extensibility. All communication from and to the gateways is encrypted.
The Cisco Physical Access Control solution offers the following modules (in addition to the Access Gateway):
* Reader module: This module can connect to a complete set of door hardware, allowing an additional door to be controlled by the same gateway.
* Input module: Eight supervised inputs can be connected to this module and controlled
through the gateway.
* Output module: Eight outputs can be connected to this module and controlled through the gateway.
Cisco Physical Security Manager (CPSM) is the software application used to manage the Cisco Access Gateways on the network. The Web-based software provisions, monitors, and controls all the access control gateways on the network. Role-based access control policies are supported for CPSM. You can create access control policies for N-person, two-door, anti-passback, etc.
CPSM also integrates with MS Active Directory, LDAP, and some HR databases.
CPSM is integrated with the Cisco Video Surveillance family of products, enabling an organization to associate cameras with doors, and to view video associated with access control events and alarms.
In addition to basic access control features, Cisco plans to integrate physical access control with network security to provide a comprehensive solution that spans both areas of security, allowing enterprises to:
* Create and enforce policies so that network and application access is granted based on the physical location of employees
* Provide wireless access only if employees have badged into a physical location.
* Terminate an employee’s active VPN connection when that employee badges into a physical location
* Change an employee’s privileges on the network based on entering or exiting a secure area
There is no question that Cisco is accelerating convergence in the physical security industry. The move to integrate physical access control and network security is something I've been preaching for a while now, it will be interesting to see how this evolves over time. I'll keep you posted...
Stay secure,
-boni bruno
Subscribe to:
Posts (Atom)
